
Our only agenda is to publish the truth so you can be an informed participant in democracy.
We need your help.
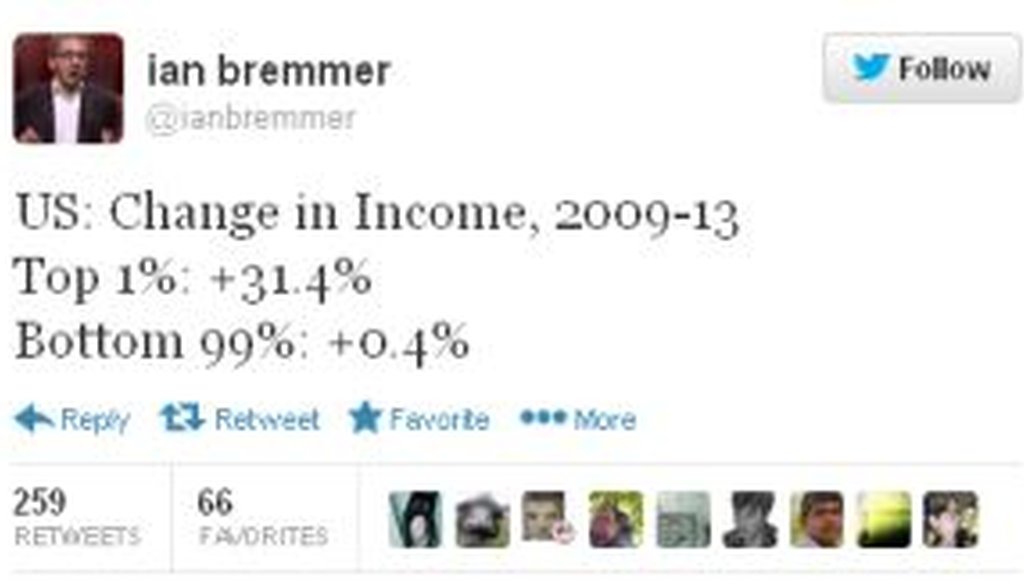
Ian Bremmer, a professor and global consultant, sent this tweet detailing income inequality in the United States in recent years. We checked his numbers.

President Barack Obama and his allies have increasingly focused on income inequality as a top policy challenge for 2014. A recent tweet by Ian Bremmer, a leading expert on the intersection between international relations and finance, seemed to provide some fuel for Obama’s concern.
Bremmer is the president and founder of the Eurasia Group, an international research and consulting firm, as well as a global research professor at New York University. On Jan. 4, 2014, he tweeted, "US: Change in Income, 2009-13. Top 1%: +31.4%. Bottom 99%: +0.4%."
We thought we’d take a closer look at Bremmer’s numbers.
We struck paydirt when we looked at the most recent data compiled by Emmanuel Saez, an economist at the University of California who has spent years studying inequality, most often with Thomas Piketty, a French economist.
In his paper, Saez found that between 2009 and 2012, the top 1 percent’s incomes grew by 31.4 percent while the bottom 99 percent’s incomes grew by 0.4 percent -- the same numbers Bremer had tweeted. This means, according to Saez’s paper, that the top 1 percent "captured 95 percent of the income gains in the first three years of the recovery."
So Bremmer can point to solid sourcing for his claim. However, not everyone is enamored of the Piketty-Saez approach.
Alan Reynolds, a scholar with the libertarian Cato Institute, has written that the Piketty-Saez methodology tends to exaggerate the earnings of the top 1 percent and underestimate the earnings of the bottom 99 percent.
The Piketty-Saez method uses pre-tax income and includes realized capital gains. This effectively boosts the measured income of the richest Americans, since they earn a lot of capital gains and they pay a lot of taxes.
Meanwhile, for the 99 percent, the Piketty-Saez method excludes transfer income -- that is, payments from the government to individuals, including such items as Social Security, unemployment insurance, Medicaid and food stamps.
Reynolds estimated that such transfer payments accounted for more than 16 percent of personal income in 2009. Transfer payments, he wrote, totaled $2.3 trillion in 2012.
Also, Reynolds argues that way the Piketty-Saez numbers are calculated makes them subject to short-term fluctuations based on taxes. He suggests that the prospect of higher taxes in 2013 may have led to a surge of bonuses and cashing out of investments that would be subject to capital gains taxes -- something that also happened in 1992 and 1986.
If true, this tendency would magnify an otherwise minor error in how Bremmer phrased his tweet. Bremmer tweeted that the figures covered the period 2009 to 2013; in fact, the Saez data, covers 2009 to 2012. The 2013 data are not available yet -- but they could look different due to the timing issue. (Bremmer told PolitiFact that he'd meant to communicate that the data went from 2009 to the start of 2013, "but that could have been expressed more clearly.")
In the meantime, one could easily produce a more nuanced narrative than the familiar rich-get-richer story. Consider this table published in the most recent Saez paper:
Time period
Average real growth in income
Real income growth for top 1 percent
Real income growth for bottom 99 percent
Fraction of total growth (or loss) captured by top 1 percent
Full period, 1993-2012
17.9 percent
86.1 percent
6.6 percent
68 percent
Clinton Expansion, 1993-2000
31.5 percent
98.7 percent
20.3 percent
45 percent
2001 Recession, 2000-2002
-11.7 percent
-30.8 percent
-6.5 percent
57 percent (of losses)
Bush Expansion, 2002-2007
16.1 percent
61.8 percent
6.8 percent
65 percent
Great Recession 2007-2009
-17.4 percent
-36.3 percent
-11.6 percent
49 percent (of losses)
Recovery, 2009-2012
6.0 percent
31.4 percent
0.4 percent
95 percent
This table -- Saez’s own data -- shows that the top 1 percent saw its inflation-adjusted income drop by 36.3 percent during the great recession, then recover by only 31.4 percent. In other words, the top 1 percent actually had a net loss between 2007 and 2012 -- a more modest net loss than the one suffered by the bottom 99 percent, to be sure, but a decline that muddies the easy story line.
Even a scholar who’s sympathetic to the Piketty-Saez approach acknowledges that it’s not the only way to look at the numbers.
"If you want the distribution of market income produced by the economy and as reported for income taxes, the Piketty-Saez numbers are the right numbers," said Timothy M. Smeeding, director of the Institute for Research on Poverty at the University of Wisconsin. "But if you want to gauge the effect of government programs on the income distribution, especially for the poor or middle classes, the outcome is different and cannot be measured by Piketty-Saez number."
Smeeding says that the degree of inequality is eased "a bit" once you take into account taxes and benefits. Still, he said, the top 1 percent still "gets a bigger share, just not as big" as the Piketty-Saez numbers show.
Our ruling
Bremmer tweeted that in the United States, the top 1 percent of earners saw their income increase by 31.4 percent between 2009 and 2013, compared to 0.4 percent for the bottom 99 percent. He took those numbers from the respected, long-running analysis of income inequality by Piketty and Saez, but this research is not the only way to look at the question. Taking into account taxes and transfer payments would reduce -- though likely not eliminate -- the difference in income gains between the 1 percent and the 99 percent. In addition, Bremmer acknowledged that his phrasing about the time frame for the data could have been clearer. His statement is accurate but needs clarification or additional information, so we rate it Mostly True.
Ian Bremmer, tweet, Jan. 4, 2013
Emmanuel Saez, "Striking it Richer: The Evolution of Top Incomes in the United States (Updated with 2012 preliminary estimates)," Sept. 3, 2013
Alan Reynolds, "The Truth about the 1 Percent," November 12, 2013
Alan Reynolds, "The Misuse of Top 1 Percent Income Shares as a Measure of Inequality," accessed Jan. 6, 2014
Email interview with Tara Sinclair, economist at George Washington University, Jan. 6, 2013
Email interview with Timothy M Smeeding, director of the Institute for Research on Poverty at the University of Wisconsin, Jan. 6, 2013
Email interview with Daniel Mitchell, senior fellow at the Cato Institute, Jan. 6, 2013
Email interview with Ian Bremmer, president and founder of the Eurasia Group, Jan. 6, 2013


In a world of wild talk and fake news, help us stand up for the facts.