“Greenland's ice sheet isn't shrinking any more rapidly today than it was 80 years ago.”


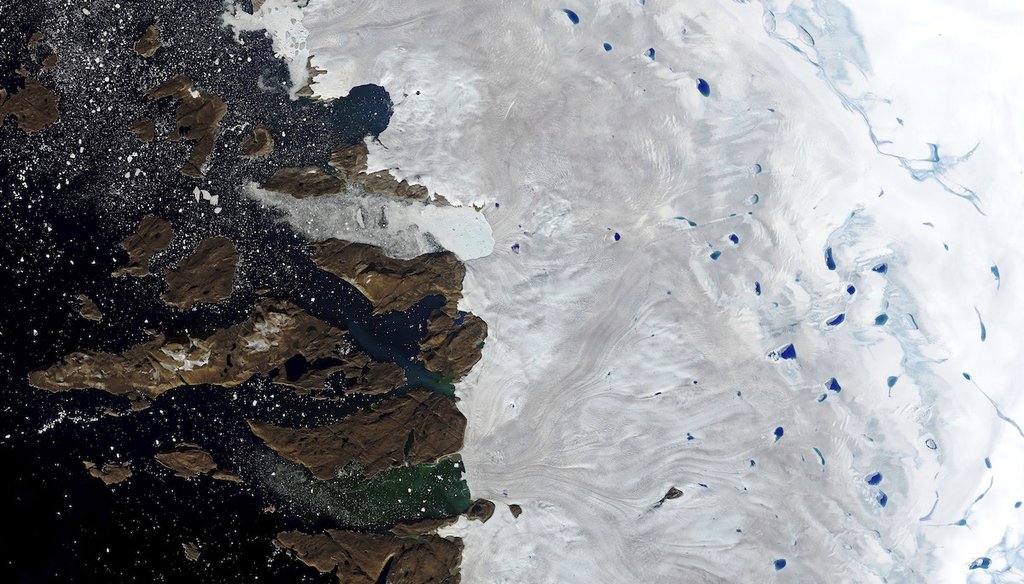
Meltwater collecting on the surface of the ice sheet in northwest Greenland near the edge of the ice sheet. (NASA via AP)

In the 1930s, the Greenland ice sheet lost about 206 gigatons of ice per year.
In the 2010s, the ice sheet lost about 247 gigatons per year.
2012 and 2019 had the largest ice losses since regular monitoring of the ice began in the 1950s.
Steven Koonin, a former Obama administration official and unofficial adviser to the EPA under President Donald Trump, says the fears of rampant climate change are overblown. In a recent video for the conservative group Prager U, Koonin noted several trends that ought to reassure people.
Among them, the ice in Greenland.
"Greenland's ice sheet isn't shrinking any more rapidly today than it was 80 years ago," said Koonin, now a New York University professor of physics.
Koonin told us he based this on a widely accepted study of the Greenland ice sheet and rising sea levels. The main problem is that study only went through 2010, and ice losses have accelerated since then. There’s been a steeper and longer lasting decline in recent decades compared with the pre-World War II period Koonin mentioned.
The Greenland ice sheet is second only to the Antarctic in size, covering about 660,000 square miles. It is a key barometer of climate change, and its fate has great importance for overall sea level changes and impacts on ocean currents.
Measuring Greenland’s ice involves much more than just tracking the area it covers. Researchers need to factor in the amount of snowfall that adds to its mass, and weigh that against the millions of gallons of water that evaporate into the atmosphere or melt into the water. Plus, in a process called calving, large chunks break off and drift away as icebergs.
Satellites provide some of the best information to track trends in the ice, but they date back only to the early 1990s. Before then, the best data came from aerial photographs in the 1930s and 1940s. When the underlying terrain is known, scientists compare pictures over the years to tell what happened with the ice.
Using historic air and sea measurements and computer models, researchers can push the estimates of the mass of the ice as far back as the mid-1800s.
Koonin told us that he relied on an article about the role of melting ice on rising sea levels. The August 2020 paper noted two periods when Greenland ice added the most to the oceans — around 1940 and after about 1990.
The highest amount came in 1937 when Greenland’s ice sheet caused the sea level to rise by .76 millimeters. In 2010, the ice sheet added .7 millimeters to the oceans. (Measuring rising sea levels due to the Greenland ice sheet and measuring ice loss from the sheet are two sides of the same coin.)
The main issue with this data is that it stops at 2010.
The latest report card for the Greenland ice sheet from the National Oceanic and Atmospheric Administration said that in 2012 and 2019, the ice sheet saw its greatest losses since regular monitoring began in the 1950s. In 2012, it shed about 464 gigatons, and in 2019, it lost about 532 gigatons. According to NASA, 1 gigaton of ice would cover Central Park in New York and reach 1,119 feet high.
"Following a period of relative stability from the 1970s to early 1990s, the ice sheet began losing ice at an accelerating rate and has now experienced annual net ice loss every year since 1998," the report said.
Many of the researchers who worked on that analysis were part of a project that pulled together multiple ways of measuring the mass of Greenland’s ice and built a tool that tracks the ice nearly in real time. They made the full data tables available and, with the help of one of those collaborators, Kristian Kjeldsen at the Geological Survey of Denmark and Greenland in Denmark, we summarized the ice loss trends decade by decade.
The overall trend is that losses have been more sustained and deeper than during the pre-WWII period that Koonin referred to in his video.
All studies of the Greenland ice sheet find that the numbers bounce around a lot from year to year. Averages for each decade help smooth out the trends. Even with the best methods, pinpoint accuracy is out of reach, and the shaded areas show the high and low estimates, with the solid line showing the mid-points. The further back in time, the bigger the uncertainty.
"Some observations point to a warm period in the late 1920s and early 1930s, which coincides with glacier retreat in the southeast," Kjeldsen said.
But he noted, after 2000, negative numbers are "more persistent."
The 1930s low point of 206 gigatons of ice sheet loss is not as large as the 247 gigatons average yearly loss between 2010 and 2020.
We counted the years of continuous decline. The current stretch of year-on-year losses since 1998 is the longest this century. (We reworked the yearly numbers several ways, looking at five-year periods and average changes during periods of ice loss. The overall trends remained the same.)
Researcher Twila Moon, deputy lead scientist with the National Snow and Ice Data Center at the University of Colorado, said the tons of ice lost today actually are more significant than losses in the 1930s. Back then, the ice sheet was bigger.
"After losing ice in the earlier part of the 20th century, the ice sheet did not expand back to its previous mass and shape," Moon said. "So as warming air and ocean temperatures arrived in the later part of the 20th century, the ice loss was picking up from a different starting point."
We shared the latest numbers with Koonin, and he highlighted the uncertainties in the estimates. By his calculations, there’s about a 40% chance that the losses were greater in the 1930s than in the 2010s.
There are different ways to calculate the odds. Andrew Dessler, professor of atmospheric sciences at Texas A&M University, estimated that there’s about a 25% chance that the losses were greater in the 1930s than in the 2010s.
In either scenario, using either estimate, that would mean there’s a greater chance the ice losses were greater in the 2010s than the 1930s.
Koonin said that "Greenland's ice sheet isn't shrinking any more rapidly today than it was 80 years ago."
Koonin relied on a study that had data through 2010. Experts agree that a period of warmer temperatures caused a large loss of ice in the 1930s. But the most recent data shows a period of steeper and longer lasting declines in the Greenland ice sheet between 2010 and 2020 than in the period 80 years ago.
There is uncertainty in the data, but Koonin’s numbers are incomplete and obscure the scale of recent ice losses. We rate this claim Mostly False.
Prager U., Instagram post, Oct. 26, 2021
Nature, The causes of sea level rise since 1900, Aug 19, 2020
Earth System Science Data, Greenland ice sheet mass balance from 1840 through next week, Oct. 29, 2021
Nature, Mass balance of the Greenland Ice Sheet from 1992 to 2018, Dec. 10, 2019
Proceedings of the National Academy of Sciences, Forty-six years of Greenland Ice Sheet mass balance from 1972 to 2018, May 7, 2019
Nature, Spatial and temporal distribution of mass loss from the Greenland Ice Sheet since AD 1900, Dec.16, 2015
National Oceanic and Atmospheric Administration, Greenland Ice Sheet: 2020 report card, 2020
Programme for Monitoring of the Greenland Ice Sheet, Data files: Greenland ice sheet mass balance from 1840 through next week, 2021
Tellus A: Dynamic Meteorology and Oceanography, Arctic climate change: observed and modelled temperature and sea-ice variability, Dc. 15, 2016
Proceedings of the National Academy of Sciences, Critical slowing down suggests that the western Greenland Ice Sheet is close to a tipping point, May 25, 2021
NASA, Video: Greenland Ice Mass Loss 2002-2020, April 1, 2021
Science Poles, History and dynamics of the Greenland Ice Sheet, May6, 2009
Scientific American, A New Book Manages to Get Climate Science Badly Wrong, May 13, 2021
Climate Feedback, Wall Street Journal article repeats multiple incorrect and misleading claims made in Steven Koonin’s new book ’Unsettled’, April 25, 2021
Email exchange, Steven Koonin, director, Center for Urban Science and Progress, New York University, Nov. 2, 2021
Email exchange, Andrew Shepherd, Centre for Polar Observation and Modeling, University of Leeds, Oct. 29, 2021
Email exchange, Thomas Frederikse, postdoctoral fellow, Jet Propulsion Laboratory, NASA, Nov. 1, 2021
Email exchange, Twila Moon, deputy lead scientist, National Snow and Ice Data Center, University of Colorado, Nov. 1, 2021
Email exchange, Beata M. Csatho, professor, Department of Geology, University at Buffalo, Nov. 1, 2021
Email exchange, Andrew Dessler, professor of atmospheric sciences, Texas A&M University, Nov. 2, 2021
Email exchange, Kristian K. Kjeldsen, senior researcher, Department of Glaciology and Climate, The Geological Survey of Denmark and Greenland, Nov. 2, 2021


In a world of wild talk and fake news, help us stand up for the facts.