

Texas has "outstripped the national poverty rate" since "at least 1959."


Our only agenda is to publish the truth so you can be an informed participant in democracy.
We need your help.
Texas remains home to a greater share of people in poverty than the nation as a whole, Bee Moorhead wrote in a September 2015, oped article in the Austin American-Statesman.
Not news? Well, Moorhead, executive director of the Texas Interfaith Center for Public Policy/Texas Impact, also wrote that according to U.S. Census Bureau figures, "Texas once again outstripped the national poverty rate" in 2014, "as we have done since at least 1959."
That’s 56 years--a long time to be better at poverty. We wondered.
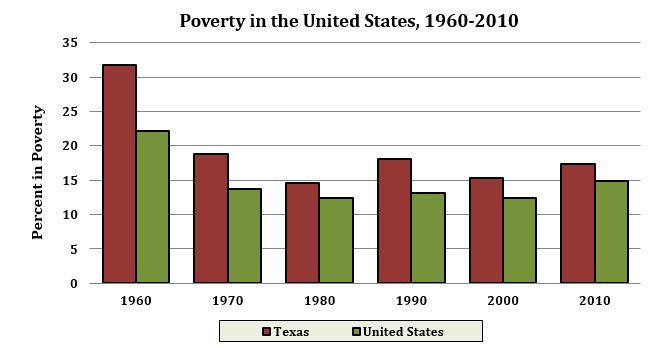
To our inquiry, Moorhead emailed us a spreadsheet, drawing on bureau figures, indicating that in select years, or each decade from 1959 through 2009, more Texans lived below the federal poverty level, by percentage, than Americans as a whole. According to the figures, which we confirmed on the bureau website, the share of Texans in poverty was greatest in 1959 — 31.7 percent, 9 percentage points greater than the 22.1 percent of Americans nationally in poverty. In the selected years, the smallest gap occurred in 1979 when 14.7 percent of Texans lived in poverty compared with 13.1 percent of Americans overall, according to the figures.
Moorhead said she separately drew the 2014 Texas poverty rate (16.4 percent) from a chart fetchable from a bureau web page last updated Sept. 16, 2015. Nationally in 2014, the bureau announced, the poverty rate was 14.8 percent, meaning 46.7 million people lived in poverty.
Moorhead also pointed out a bureau website enabling comparisons of poverty in a state to the nation each decade from 1960 through 2010, leading us to develop this Texas-U.S. comparison:
Measuring poverty
Through the bureau, the federal government has estimated residents living in poverty for more than 50 years, initially from a U.S. Department of Agriculture estimate of how much income that families under economic stress needed in order to put food on the table. How the government defines poverty has changed a bit over the years, but generally, the bureau says, it "uses a set of money income thresholds that vary by family size and composition to determine who is in poverty. If a family's total income is less than the family's threshold, then that family and every individual in it is considered in poverty." The thresholds don’t vary by location, the bureau says, but are updated for inflation. The poverty definition rolls in income before taxes and does not include capital gains or noncash benefits (such as public housing, Medicaid, and food stamps), the bureau says.
Each year’s national poverty estimates derive from the bureau’s Annual Social and Economic Supplement to the Current Population Survey, which surveys about 100,000 households a year, asking about income from more than 50 sources, according to the bureau.
An expert’s look
Moorhead did not delve into poverty rates for every year from 1959 on, so we asked Daniel Dillon of the University of Texas Child and Family Research Partnership for a look. Drawing from CPS data, he put together a chart suggesting the Texas poverty rate exceeded the national rate each year from 1959 through 2014.
But Dillon and bureau spokesman Robert Bernstein told us that comparative year-by-year figures start only in 1980.
Since 1980, Dillon summed up, the Texas poverty rate "has generally bounced between 15 percent and 17 percent with a few exceptions. The fact that is it so consistent means that the rate of growth in the general population is basically on par with the rate of growth in the poor population. Sometimes they don’t change at the same rate though, like after the recession, where the number of poor shot up but population growth was stable. This caused the poverty rate to increase. So the poverty rate is reflecting the interplay between total population change and poor population change, the latter of which is generally more affected by fluctuations in the economy."
Big picture: The 4.4 million Texans in poverty in 2014 was double the 2.2 million residents in poverty in 1980, Dillon noted. In the period, the state’s total population increased 87 percent, escalating from 14.3 million to 26.7 million, he noted.
Dillon pointed out there were times the gap between poverty in Texas and the nation narrowed, including 2014. Broadly, he wrote, the gap grew through the 1980s until about 1988, at which point it peaked at a difference of 5 percentage points. Then the gap began to narrow, he wrote, expanding and contracting every few years until 2010 when it began to close. "In 2014, Texas had a poverty rate 1.6 percentage points above the national rate," Dillon said. "That’s the closest we have been to the national rate since 1984, when the gap was 1.3 percentage points."
Several factors, Dillon said, explain why Texas has consistently had a bigger chunk of residents in poverty than the nation on average. The state is home to a larger foreign-born population than most states and is one of a few minority-majority states in that non-Hispanic whites make up a minority of the residents, he wrote. "In comparison to their numbers, minority groups in Texas tend to be overrepresented among the poor. Education level is also strongly linked to poverty status, and Texas is the near the bottom when it comes to the percentage of the adult population with a high school degree," Dillon said. "Finally, Texas has a higher percentage of children than most states and child poverty has been on the rise. Today, a quarter of Texas children live below the poverty line."
Dillon said the narrowing gap between the Texas and national poverty rates might be explained by the state generally growing faster than most states due both to new births and migration from other places. "As long as the mix of people moving to Texas are more likely to be above the poverty line than below it, this will drive the poverty rate down. Similarly, if births to non-poor families outpace those to poor families, this will also drive the rate down," Dillon wrote.
Another indicator
We also asked Lori Taylor, a Texas A&M University economist, to evaluate Moorhead’s claim. By phone, Taylor said that while it’s likely the Texas poverty rate has consistently outpaced the national rate, on average, it’s worth mention that the rate has always been calculated by assuming the same income levels put residents in poverty regardless of location. She said this has tended to lead to overstatements of people in poverty in lower cost-of-living parts of the country and understatements of residents in poverty in high-cost areas. Taylor and a colleague pointed out in a December 2014 article that in 2013, per the government's poverty threshold, a family of four with two children and a household income of $23,624 was classified as poor regardless of whether the family lived in rural Arkansas, where a typical two-bedroom apartment rents for less than $600, or in New York, where a two-bedroom apartment rents for more than $1,400.
In the past few years, the census bureau has been developing its Supplemental Poverty Measure, which reaches its rates by taking into account regional differences in housing costs. And, Taylor noted, the bureau found in its 2013 surveys that Texas and the U.S. had the same 15.9 percent SPM rate. In contrast, the general 2013 poverty rate for the country was 14.8 percent and the Texas rate was 16.9 percent.
By phone, Moorhead agreed that "using a standard measure" of poverty "across the country is insufficient to characterize the complexity of regional economies." But the SPM is a new measure too, she said, and rates haven’t been calculated retroactively to cover nearly all the years included in her Texas-U.S. comparison.
Our ruling
Moorhead said Texas has "outstripped the national poverty rate" since "at least 1959."
Available poverty rates for select years through 1979 and for 1980 through 2014 back up this statement.
Yet poverty rates don’t appear to be available for many earlier years. Also, a new supplemental poverty measure makes a case for the same share of Texans and Americans lately living in poverty provided regional differences in housing costs are factored in.
We rate this claim Mostly True.
MOSTLY TRUE – The statement is accurate but needs clarification or additional information.
Click here for more on the six PolitiFact ratings and how we select facts to check.
Oped article, "Moorhead: Texas needs to address poverty, pollution and polarization," Bee Moorhead, executive director, Texas Interfaith Center for Public Policy/Texas Impact, in the Austin American-Statesman, posted online Sept. 28, 2015
U.S. Census Bureau charts showing poverty rates by state and nationally, selected years, 1959-1999 (each decade) and "Poverty Status By State, 2014--All Ages," (cited by Bee Moorhead)
Emails, Robert Bernstein, public affairs specialist, Media Relations, Public Information Office, U.S. Census Bureau, Oct. 1, 2015
Charts, U.S. Census Bureau, "PERSONS BY POVERTY STATUS IN 1959, 1969, 1979, 1989, AND 1999 BY STATE," "Poverty Status of People by Family Relationship, Race, and Hispanic Origin: 1959 to 2014," "Number of Poor and Poverty Rate, by State: 1980 to 2014" (downloaded from the bureau’s website, Oct. 6, 2015)
Web pages, U.S. Census Bureau, "How the Census Bureau Measures Poverty," last updated Sept. 15, 2015; "Description of Income and Poverty Data Sources," last updated Sept. 16, 2015 (accessed Oct. 7, 2015)
Press release, "Income, Poverty and Health Insurance Coverage in the United States: 2014," U.S. Census Bureau, Sept. 16, 2015
Emails (excerpted), Daniel Dillon, senior research associate, Child and Family Research Partnership, the University of Texas, Oct. 2, 6 and 8, 2015
Chart showing U.S., Texas poverty rates for selected years 1959 to 1979, 1980-2014, chart showing poverty rates and Texas population growth, researched by Daniel Dillon, senior research associate, Child and Family Research Partnership, the University of Texas (received by email Oct. 2, 2015)
Telephone interview, Lori Taylor, Verlin and Howard Kruse '52 Founders associate professor, Bush School of Government and Public Service, director, Robert A. Mosbacher Institute for Trade, Economics and Public Policy, Texas A&M University, Oct. 9, 2015
Report, "The Supplemental Poverty Measure: 2013," U.S. Census Bureau, October 2014
Article, "The War on Poverty Needs A New Map," Lori L. Taylor and Jawad Dar, in The Takeaway, the Mosbacher Institute for Trade, Economics and Public Policy, December 2014
Telephone interview, Bee Moorhead, Oct. 9, 2015


In a world of wild talk and fake news, help us stand up for the facts.