

In a spirited exchange on the House floor the other day, Republican Rep. Mike Pence used a popular GOP talking point about the economic stimulus package. "Where are the jobs?" he asked.
Rep. Steny Hoyer of Maryland, the No. 2 Democrat in the House, responded by saying job losses were worse under President George W. Bush.
"We have lost 200,000 less jobs per month than Bush lost in his last three months in office, over the last three months." His syntax was a bit spotty, but the point was clear — that the scale of job losses was greater during the end of the Bush administration than it has been over the past few months under President Barack Obama.
We turned to the Bureau of Labor Statistics, the government agency that keeps employment data, to sort this out. When we asked how the bureau would go about checking Hoyer's math, Gary Steinberg, a BLS press officer, told us to look at the monthly changes in seasonally adjusted, nonfarm payrolls.
First we compiled the numbers for Bush's last three months. Between October and November, 597,000 jobs were lost; between November and December, 681,000 were lost; and between December and January, 741,000 were lost.
For the most recent three months under Obama: 519,000 jobs were lost between March and April, 322,000 from April to May, and 467,000 May to June.
There are two ways to look at these numbers. While Hoyer’s language leaves some room for interpretation about what he meant, the most reasonable measurement may be to average the three months for each president and then compare the result. Calculated this way, the average job losses under Bush’s three months were 673,000, versus 436,000 for Obama. Subtract Obama’s number from Bush’s and you find that Obama had, on average, 237,000 fewer monthly job losses — meaning that Hoyer was correct. In fact, he understated the difference.
Another way to look at it would be to see if any single month-to-month comparison netted a difference smaller than 200,000. Looking at all nine possible month-to-month comparisons, it turns out that six of the nine comparisons, or two-thirds, match or exceed Hoyer’s benchmark difference of 200,000. So by this measure, Hoyer isn’t perfect, but he’s right more often than he’s not.
We used the above methodology to calculate the numbers after we spoke with two economists — Gary Burtless, an economist with the moderate-to-liberal Brookings Institution and a former economist with the Labor Department, and Anna Turner, a research assistant with the liberal Economic Policy Institute. They agreed with the BLS spokesman about using the change in nonfarm payrolls.
But there is another way to slice and dice BLS’ statistics. When we asked the Employment Policies Institute, a think tank funded by businesses, how it would sift the numbers, a spokeswoman suggested looking at month-to-month changes in unemployment, rather than employment. The employment figures come from a payroll survey of 400,000 work sites, whereas unemployment figures come from a survey of 60,000 households.
Lo and behold, using this measurement dramatically changes the outcome.
The monthly increases in unemployment during Bush’s final three months were 255,000 from October to November, 632,000 from November to December, and 508,000 from December to January. Averaged out, that’s an increase of 465,000 unemployed Americans per month under Bush.
By contrast, under Obama, the nation lost 563,000 jobs between March and April, 787,000 between April and May and 218,000 between May and June. On average, the changes in unemployment were 523,000 per month under Obama — a number that’s actually higher than what it was under Bush. So using these figures, Hoyer would be wrong.
We asked a cross-section of economists whether one measure was inherently better than the other. On this question, the conservatives and liberals we spoke to agreed: Charting employment by using the payroll survey, as Hoyer appears to have done, is indeed the economist's preferred way of doing it.
"Using payroll employment is the way to go — looking at unemployment levels is messy because the labor force is always changing," said Heidi Shierholz, an economist with the liberal Economic Policy Institute. "A general rule of thumb: Look at payroll employment changes, or unemployment rate changes."
J.D. Foster of the conservative Heritage Foundation agreed. "If you’re not employed, you get into various issues of why you’re not employed," he said. "Did you retire? Are you leaving because you’re discouraged about finding a job?" By contrast, he said, "if you’re employed, you’re employed."
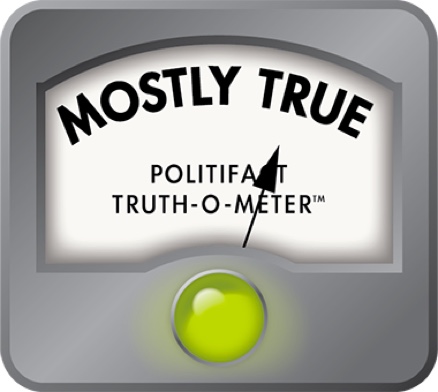
So Hoyer’s figures mostly hold up under scrutiny. He's right if you calculate an average, but he's only right six of nine times when you look at the monthly changes. So we rate his statement Mostly True.
House floor speech by Rep. Steny Hoyer, D-Md., July 21, 2009
Bureau of Labor Statistics chart showing monthly change in employment, accessed July 22, 2009
Bureau of Labor Statistics chart showing monthly change in unemployment, go to this link and check box for seasonally adjusted unemployed, then "retrieve data," accessed July 22, 2009
E-mail interview with Gary Steinberg, Bureau of Labor Statistics press officer, July 22, 2009
Interview with Gary Burtless, Brookings Institution economist, July 22, 2009
E-mail interview with Samantha O’Neil, spokeswoman, Employment Policies Institute, July 22, 2009
E-mail interviews with Anna Turner and Heidi Shierholz, economists, Economic Policy Institute, July 22, 2009
Interview with J.D. Foster, economist, Heritage Foundation, July 22, 2009
In a world of wild talk and fake news, help us stand up for the facts.