Get PolitiFact in your inbox.
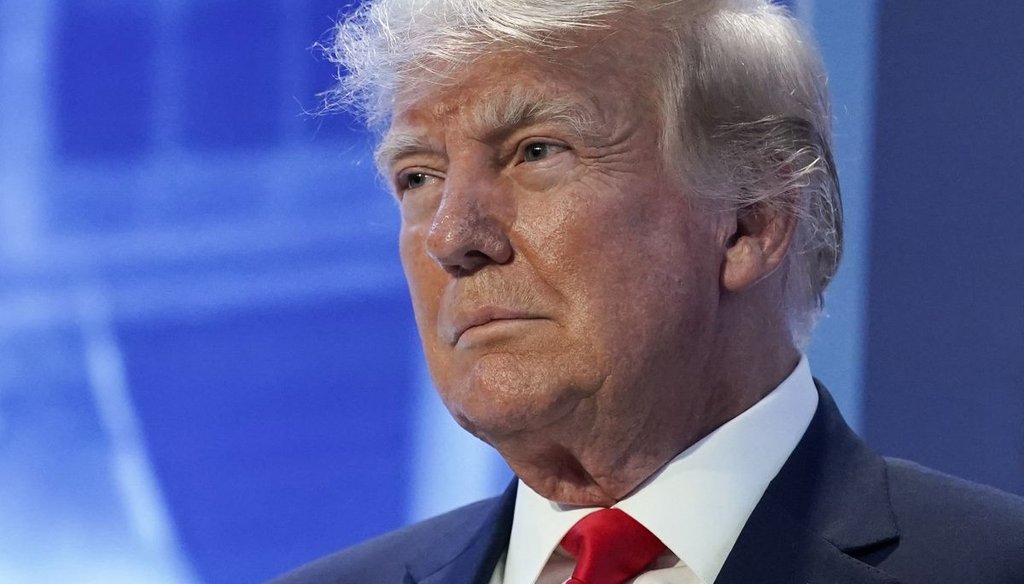
Former President Donald Trump in Philadelphia on June 30, 2023. (AP)
Days after his fourth indictment, former President Donald Trump released a video on a very different topic: the economy.
In his Aug. 16 video, released on the conservative video site Rumble and mass emailed to supporters, Trump touted his economic record and suggested it outperformed that of his successor and potential 2024 presidential rival, Joe Biden.
"Any numbers you see that are economically positive in the Biden administration are because they're running on the fumes of what we created years prior to their taking office," Trump said.
Separately, Trump repeated several of the talking points during an Aug. 17 interview with Fox Business Network host Larry Kudlow, who was once an economic adviser in Trump’s White House.
Although some of Trump’s statements are accurate, particularly on mortgage rates, others are either misleading or plain wrong. He often cherry-picks data to minimize the economic fallout during his presidency, while maximizing the pandemic’s impact on the economy during Biden’s tenure.
Here’s a rundown of six Trump claims.
"Under Biden, real incomes have gone down by $7,400 per family. Under President Trump, yearly income went up by more than $6,000."
This is wrong on both ends.
In footnotes to the speech, the campaign cited inflation-adjusted median household income, saying it "increased from $66,657 in 2016 to $72,808 in 2019."
Those numbers are correct — but Trump also served as president for all of 2020.
In 2020, the first year of the coronavirus pandemic, this income figure dropped to $71,186. So, the gain on Trump’s entire watch was $4,529, not "more than $6,000."
If you use the same statistic for Biden, there has been a loss, but a much more modest one than Trump said. The most recent figure available is for 2021, which represented a drop of $402, not the $7,400 Trump cited. (It’s unknown what the 2022 data will show.)
To get the $7,400 loss under Biden, Trump cites an analysis by the conservative Heritage Foundation. It said in January 2023 that the average family "has effectively lost $7,400 in annual income since Biden took office" because of inflation.
The Heritage Foundation did not explain its calculation, but it would not have been an apples-to-apples comparison to the figure under Trump because the available inflation data stopped at December 2022. Since then, inflation has more than halved, slipping to about 3%.
"Just 2.1 million new jobs have been created during Biden's first 30 months in office, which is a disgrace. By contrast, in my first 30 months in office, we created 4.9 million new jobs."
This is a repeat of a statement we rated False.
Trump is wrong both on the numbers of jobs and on who oversaw more job gains. During Trump’s first 30 months, the number of nonfarm jobs rose by 5.2 million, but during Biden’s first 30 months, the number rose by 13.2 million.
Trump’s campaign justifies his accounting by saying that Biden doesn’t deserve credit for about 11 million jobs gained during the post-pandemic bounceback. But an ideologically diverse group of economists told PolitiFact that Trump’s approach treats the two presidents unequally, and in a self-serving way.
Trump’s method of using the first 30 months superficially seems fair to Biden, who has served that many months in office. But it effectively eliminates any pandemic job losses from Trump’s column and shifts them all to Biden.
"Inflation has reached the highest level in half a century."
This needs context.
Inflation did hit the highest level in four decades in June 2022, at about 9%. But it fell to about one-third of that level in the subsequent year.
"Mortgage rates are pushing a brutal 7%."
This is accurate.
For the most recent week available at the time of Trump’s video, the week of Aug. 10, the average for 30-year fixed-rate mortgages was 6.96%. On Aug. 17, after his video was posted, the rate rose again, to 7.09%. This is a consequence of the Federal Reserve’s quest to stamp out inflation by raising interest rates.
"When I was your president, the 30-year mortgage rate reached a record low of 2.65%."
Trump is close, but this needs context.
The mortgage rate fell to 2.65% on Jan. 7, 2021, although it rose to 2.79%, by his final week in office, the week of Jan. 14.
But Trump leaves out that this low point for mortgage rates came amid the pandemic, when officials were more concerned about promoting economic activity. At the time, the Federal Reserve was setting its interest rate near zero.
Mortgage rates continued to be about that low during the first year of Biden’s presidency. But then. inflation concerns increased and the Fed began raising its interest rate.
"We had gasoline down to $1.87 a gallon."
Gasoline has surely been pricier under Biden, but Trump’s figure ignores the unusual pandemic-driven circumstances around that low amount.
National average gasoline prices fell to $1.79 in May 2020, when much economic activity, commuting and travel stopped.
When Trump left office — as the pandemic was easing but still having a major economic impact — average gasoline prices were higher, $2.38. And over the course of his presidency, the price averaged $2.48.
Experts say key reasons gasoline prices have been under Biden are the return to economic normalcy, which increased demand, and the war in Ukraine, which led Western nations to limit their purchases of Russian oil, constraining supply, at least temporarily.
Under Biden, gasoline peaked at $5 in June 2022, then fell as low as $3.09 in December 2022 before rising to $3.85 in August 2023.
Overall, gasoline prices under Biden through August 2023 have averaged $3.51. That’s significantly higher than under Trump.
Our Sources
Donald Trump, video on the economy, Aug. 16, 2023
Federal Reserve Bank of St. Louis, inflation-adjusted median household income, accessed Aug. 17, 2023
Federal Reserve Bank of St. Louis, 30-year fixed rate mortgage average in the United States, accessed Aug. 17, 2023
Federal Reserve Bank of St. Louis, all employees, total nonfarm, accessed Aug. 17, 2023
Federal Reserve Bank of St. Louis, federal funds effective rate, accessed Aug. 17, 2023
Energy Information Administration, weekly U.S. regular all formulations retail gasoline prices, accessed Aug. 17, 2023
Heritage Foundation, "New Heritage Analysis Finds Average American Family Is Effectively $7,400 Poorer Under Biden," Jan 12, 2023
PolitiFact, "Under Joe Biden, is inflation coming down or are prices much higher? Both," July 31, 2023
PolitiFact, "Donald Trump vastly underestimates job gains under Joe Biden," August 8, 2023
PolitiFact, "How strong is consumer confidence under Joe Biden?" August 3, 2023


