
Says the Associated Press was wrong to report that "Income Inequality grew to largest in 50 years" because in a "new Census report all four measures of income inequality SHRUNK, reversing rise over past five decades."


Our only agenda is to publish the truth so you can be an informed participant in democracy.
We need your help.
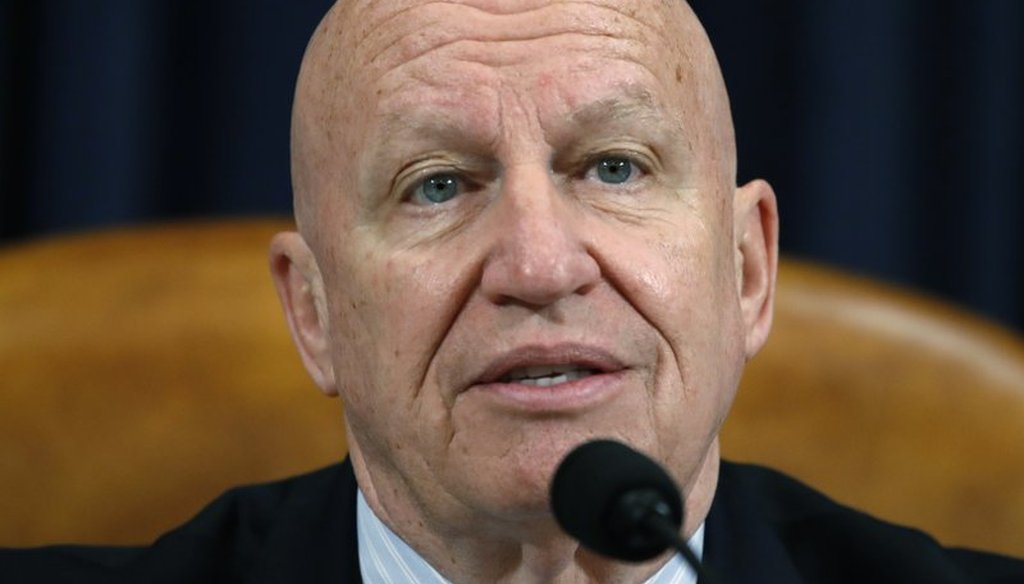
U.S. Rep. Kevin Brady, R-Texas, speaks during a committee hearing on Capitol Hill in Washington in February of 2018 (AP Photo/Jacquelyn Martin).

U.S. Rep. Kevin Brady, a Texas Republican, tried his hand at fact-checking in a tweet that suggested a news report from The Associated Press inaccurately characterized the state of income inequality in the United States.
His post — which caught our attention due to his unauthorized use of a PolitiFact Truth-O-Meter image — started by summarizing the findings of the news article: "Income Inequality grew to largest in 50 years."
"FACT: Just the opposite," Brady wrote. "In new Census report all four measures of income inequality SHRUNK, reversing rise over past five decades."
We had to ask: Who is right? Is the United States experiencing the highest levels of income inequality in the past 50 years, or do the latest figures show a decline in inequality?
News reports describe growing inequality
Let’s start with The Associated Press article, which was published upon the release of new income information from the U.S. Census Bureau’s American Community Survey at the end of September.
"The gap between the haves and have-nots in the United States grew last year to its highest level in more than 50 years of tracking income inequality," the story reads, attributing the information to the Census Bureau.
The article goes on to discuss a change to the Gini Index — a common summary measure of income inequality. The value ranges from 0 (perfect equality, when everyone receives an equal share) to 1 (perfect inequality, when one group or recipient receives all the income).
In 2018, the American Community Survey put the Gini Index at 0.485, a statistically significant increase from 2017, when the Gini Index was estimated to be 0.482.
Multiple news outlets wrote articles about the new data released by the Census Bureau, including The Washington Post.
"Income inequality in the United States has hit its highest level since the Census Bureau started tracking it more than five decades ago, according to data released Thursday, even as the nation’s poverty and unemployment rates are at historic lows," the Post article reads.
National Public Radio reported that the "gap between the richest and the poorest U.S. households is now the largest it’s been in the past 50 years."
In the Census Bureau’s press release announcing the latest survey, the agency said income inequality in 2018 was "significantly higher" than in 2017.
So, how is it possible that Brady came to a different conclusion about the status of income inequality in the U.S. after reviewing Census Bureau data?
"The most obvious thing going on is that they are talking about two different data sources," said Rakesh Kochhar, a senior researcher at the Pew Research Center who studies trends in income and wealth.
Two surveys have different results
Isabelle Gwozdz, a spokeswoman for Brady, said his claim was based on the latest report of the Current Population Survey released by the Census Bureau in September.
The Current Population Survey is a joint effort between the Census Bureau and the U.S. Bureau of Labor Statistics to track statistics on employment, earnings and education across the country.
It is a different project than the American Community Survey, which has a significantly larger sample size and collects information on population, housing and other topics — including income.
Kochhar said the Current Population Survey should be "understood as a national survey," while the American Community Survey "is designed for measurement across states, metro areas and counties."
"The two surveys are different in methodology, sample size, and reporting period, so it’s not unusual for them to report slightly different findings," said David Cooper, a senior economic analyst at the Economic Policy Institute.
A key difference between the surveys is that the Current Population Survey asks more detailed questions about income than the American Community Survey. Plus, the Current Population Survey uses a smaller sample size.
For analyzing national income estimates, the Census Bureau generally recommends using the Current Population Survey over the American Community Survey, according to a statement from the agency.
While the Current Population Survey can show changes in income inequality over longer periods of time, "it is relatively rare for year-to-year changes in the Gini to be statistically significant," due to the small sample size of the survey, according to the statement.
The Current Population Survey also uses the Gini Index, as well as three other summary measures of inequality — Theil, Atkinson and Mean Logarithmic Deviation — while the American Community Survey only includes Gini.
"However, they are also difficult to interpret, whereas the Gini has a more straightforward interpretation," reads the statement from the Census Bureau. "The Gini coefficient is the most commonly used measure of inequality."
The value for Gini can vary, depending on the survey and other factors.
Gwozdz said when Brady referenced "four measures of income inequality," he was looking at values for Gini, Theil, Atkinson and the Mean Logarithmic Deviation from the Current Population Survey report on 2018 Income and Poverty.
The Current Population Survey report uses two different "income concepts" to measure inequality: money income and equivalence-adjusted income.
Money income is household income, while equivalence-adjusted income considers the number of people in a household and how they might share resources.
Looking just at money income, all four summary measures appeared to show declining inequality from 2017 to 2018. But none of the decreases is considered statistically significant.
"If I go to the CPS estimate for 2018, it is no different than the estimate for 2017, statistically speaking," Kochhar said. "It did decrease, but it was not enough to be statistically significant. All you can say from CPS is that there was no change between 2017 and 2018."
The Census Bureau analyzed changes to the Gini Index in the Current Population Survey report and said that, from that data, "we cannot say with confidence whether the Gini increased slightly, decreased slightly, or was relatively unchanged."
Looking at equivalence-adjusted income, all four measures decreased from 2017 to 2018. Three of the measures, not including the Mean logarithmic deviation, saw a statistically significant decrease.
The Census Bureau and economics experts we consulted for this fact-check said it is normal to see variations in these measurements, depending on the source of the data and the income concept used for the estimate.
Ken-Hou Lin, a sociology professor at the University of Texas at Austin, said that both The Associated Press and Brady should be more cautious with their interpretations of the Census Bureau data.
"In general, there’s never a large year-to-year change in inequality," he said. "Thus, it is difficult to separate the real trend from statistical noise."
Kochhar agreed, and said looking at incremental changes to income inequality does not tell the whole story.
"I would conclude that, in the times we currently are, income inequality is higher than it has been in five decades," Kochhar said. "Whether this year is different than last year, that is one slice out of the five decades."
Cooper of the Economic Policy Institute offered a similar assessment.
"Bottom line: The AP story is accurate," Cooper said. " None of the statistics that Mr. Brady cites disprove anything that the AP story reports."
Our ruling
Brady said that the Associated Press was wrong to report that "Income Inequality grew to largest in 50 years" because in a "new Census report all four measures of income inequality SHRUNK, reversing rise over past five decades."
Brady used a different Census Bureau survey than the Associated Press to make his claim. Both surveys had slightly different findings about income inequality — a normal occurrence, according to multiple experts.
The survey the Associated Press used showed a statistically significant increase in income inequality from 2017 to 2018, using the only measurement of inequality included in the survey.
In the survey Brady cited, estimates for four measures of income inequality were generated using two different categories of income.
In one category, three of the four measures saw a statistically significant decrease from 2017 to 2018. In the other category, none of the measurements experienced a statistically significant change.
Plus, experts said year-to-year changes in income inequality are not indicative of larger trends, so it is a stretch to suggest that the 2018 figures signal a reverse in the rise over the past five decades.
We rate this claim Mostly False.
MOSTLY FALSE — The statement contains an element of truth but ignores critical facts that would give a different impression.
Tweet, U.S. Rep. Kevin Brady, Oct. 7, 2019
Email interview with Isabelle Gwozdz, spokesperson for Kevin Brady, Oct. 7, 2019
Associated Press, Census: U.S. inequality grew, including in heartland states, Sept. 26, 2019
Washington Post, Income inequality in America is the highest it’s been since Census Bureau started tracking it, data shows, Sept. 26, 2019
National Public Radio, U.S. Income Inequality Worsens, Widening To A New Gap, Sept. 26, 2019
U.S. Census Bureau, Income and Poverty in the United States: 2018, Sept. 2019
U.S. Census Bureau, Historical Income Tables: Income Inequality, accessed Oct. 7, 2019
U.S. Census Bureau, American Community Survey Provides New State and Local Income, Poverty and Health Insurance Statistics, Sept. 26, 2019
U.S. Census Bureau, Gini Index, accessed Oct. 7, 2019
U.S. Census Bureau, Fact Sheet: Differences Between the American Community Survey (ACS) and the Annual Social and Economic Supplement to the Current Population Survey (CPS ASEC), accessed Oct. 8, 2019
Phone interview with Daniel Hamermesh, professor emeritus at the University of Texas at Austin, Oct. 7, 2019
Email interview with Ken-Hou Lin, associate sociology professor at the University of Texas at Austin, Oct. 7, 2019
Phone interview with Lin, Oct. 8, 2019
Email interview with David Cooper, senior economic analyst at the Economic Policy Institute, Oct. 8, 2019
Phone interview with Rakesh Kochhar, senior researcher at Pew Research Center, Oct. 8, 2019
Email interview with Jewel Jordan, spokesperson for the U.S. Census Bureau, Oct. 9, 2019


In a world of wild talk and fake news, help us stand up for the facts.