
Our only agenda is to publish the truth so you can be an informed participant in democracy.
We need your help.


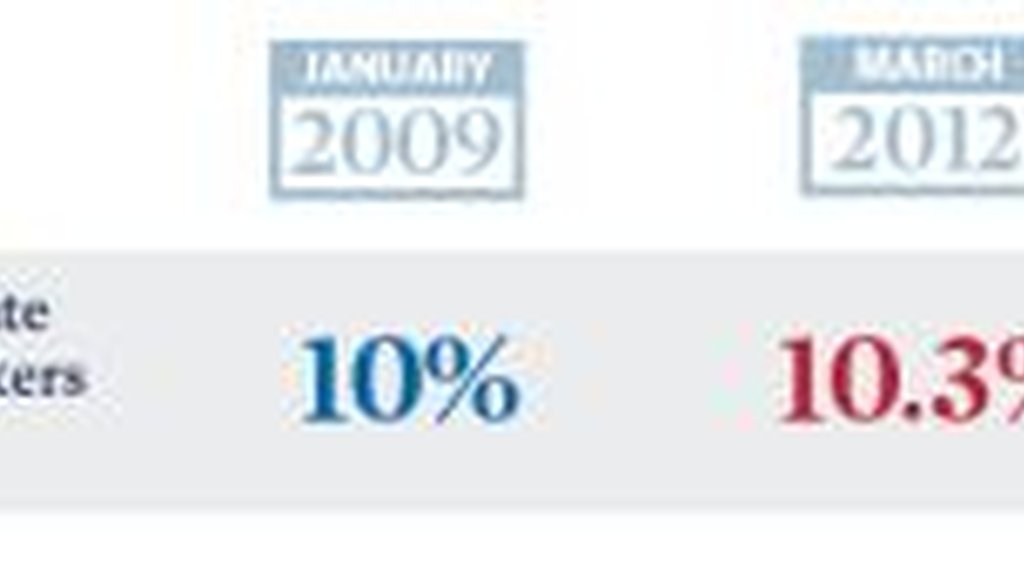
This is an excerpt from a graphic released by Mitt Romney's presidential campaign addressing unemployment among Hispanics.
In a mid April Pew poll, Mitt Romney trailed President Barack Obama among Hispanic voters, who gave the president a whopping 67 percent to 27 percent margin. In an effort to bolster his standing with this key electoral group, Romney’s campaign on April 20, 2012, released a statistical graphic that takes a shot at Obama’s record on Hispanic unemployment.
Among the statistics cited was this one: "The total unemployment rate for Hispanic or Latino workers has increased from 10% to 10.3%." The time frame was between January 2009 and March 2012.
We decided to take a closer look.
We turned to unemployment data produced by the Bureau of Labor Statistics, the federal government’s official agency for such numbers. We found that the Hispanic unemployment rate in January 2009 was indeed 10.0 percent, and the rate in March 2012 -- the most recent month available -- was 10.3 percent.
But that isn’t the whole story.
Obama took office on Jan. 20, 2009, about two-thirds of the way through the month. One could just as easily have considered the first month on his watch to be February 2009 -- the first month during which he was president for the entire time. And if you start the clock in February 2009, just one month later, the picture is significantly different.
In February 2009, the Hispanic unemployment rate was 11.1 percent. Using that as the baseline, Hispanic unemployment fell by eight-tenths of a percentage point by March 2012 -- instead of rising three-tenths of a percentage point.
The fact that there is a major difference if you move the starting point by just one month is not surprising. Hispanics are heavily represented in the construction industry, a sector that was hit unusually hard in the first year of the recession.
Indeed, job prospects for Hispanics were in a free fall by the time Obama took office. In the year-long span between January 2008 and January 2009 -- a period when George W. Bush was president -- Hispanic unemployment rose from 6.5 percent to 10.0 percent, far faster than it did during Obama’s tenure even if you do begin counting in January 2009.
The point isn't that starting the count in February is vastly superior to starting in January. But when two plausible options offer such widely divergent results, picking the one that spins the claim in a way much more favorable to Romney is clearly cherry-picking.
In the meantime, there’s also an argument -- one we’ve made before -- that it’s unfair to blame Obama for job losses very early in his term. In fact, the pattern seen when you start in February only gets stronger the further you go into Obama’s first year. If you start counting six months into his tenure, the reduction in Hispanic unemployment on his watch has been 2.2 percentage points, and if you start counting nine months into his tenure, it's been 2.7 percentage points -- a sharply different scenario than the one in Romney’s graphic.
One additional factor: There’s a lot of uncertainty in the data that casts doubt on whether it can be used to support sweeping conclusions.
When you slice the monthly unemployment data by ethnic groups, such as Hispanics, "the sample sizes become small enough to introduce a fair amount of sampling error into the resulting statistics," said Steven J. Davis, an economist at the University of Chicago Booth School of Business, who served as an outside adviser to John McCain’s 2008 presidential campaign.
Davis noted that according to BLS, the approximate margin of error for the monthly unemployment rate for Hispanics is 0.34. That’s more than twice as wide as the margin of error for the measurements of men and women, and more than three times as wide as the margin of error for unemployment figures for the population as a whole.
So in reality, the January 2009 figure might have been as high as 10.3 percent instead of 10 and the March 2012 figure could have been as low as 10 percent instead of 10.3. (Or it could have risen from 9.7 percent to 10.6 percent over the same period -- we just don’t know.)
"It is hard to say whether the January or February 2009 data provide a more accurate indication of the likely Hispanic unemployment rate at the beginning of the Obama Administration," Davis said. "Similar points apply to the March 2012 measure."
Our ruling
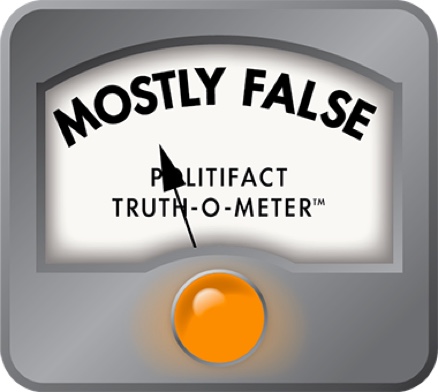
The Romney campaign said that "the total unemployment rate for Hispanic or Latino workers has increased from 10% to 10.3%" between January 2009 and March 2012. The numbers the Romney team cites are accurate, but they may not be statistically significant, and if you use equally plausible time frames, the numbers tell a dramatically different story. These amount to missing critical facts that would have given a different impression. That's our definition of Mostly False.
Mitt Romney for President, "Hispanics & The Obama Economy" (Infographic), April 20, 2012
Bureau of Labor Statistics, main page for Labor Force Statistics from the Current Population Survey, accessed April 23, 2012
Bureau of Labor Statistics, "Household Data (‘A’ tables, monthly; ‘D’ tables, quarterly)," February 2006
Pew Research Center, "With Voters Focused on Economy, Obama Lead Narrows," April 17, 2012
Email interview with Gary Burtless, senior fellow at the Brookings Institution, April 23, 2012
Email interview with Steven J. Davis, professor of international business and economics at the University of Chicago Booth School of Business, April 23, 2012
In a world of wild talk and fake news, help us stand up for the facts.
